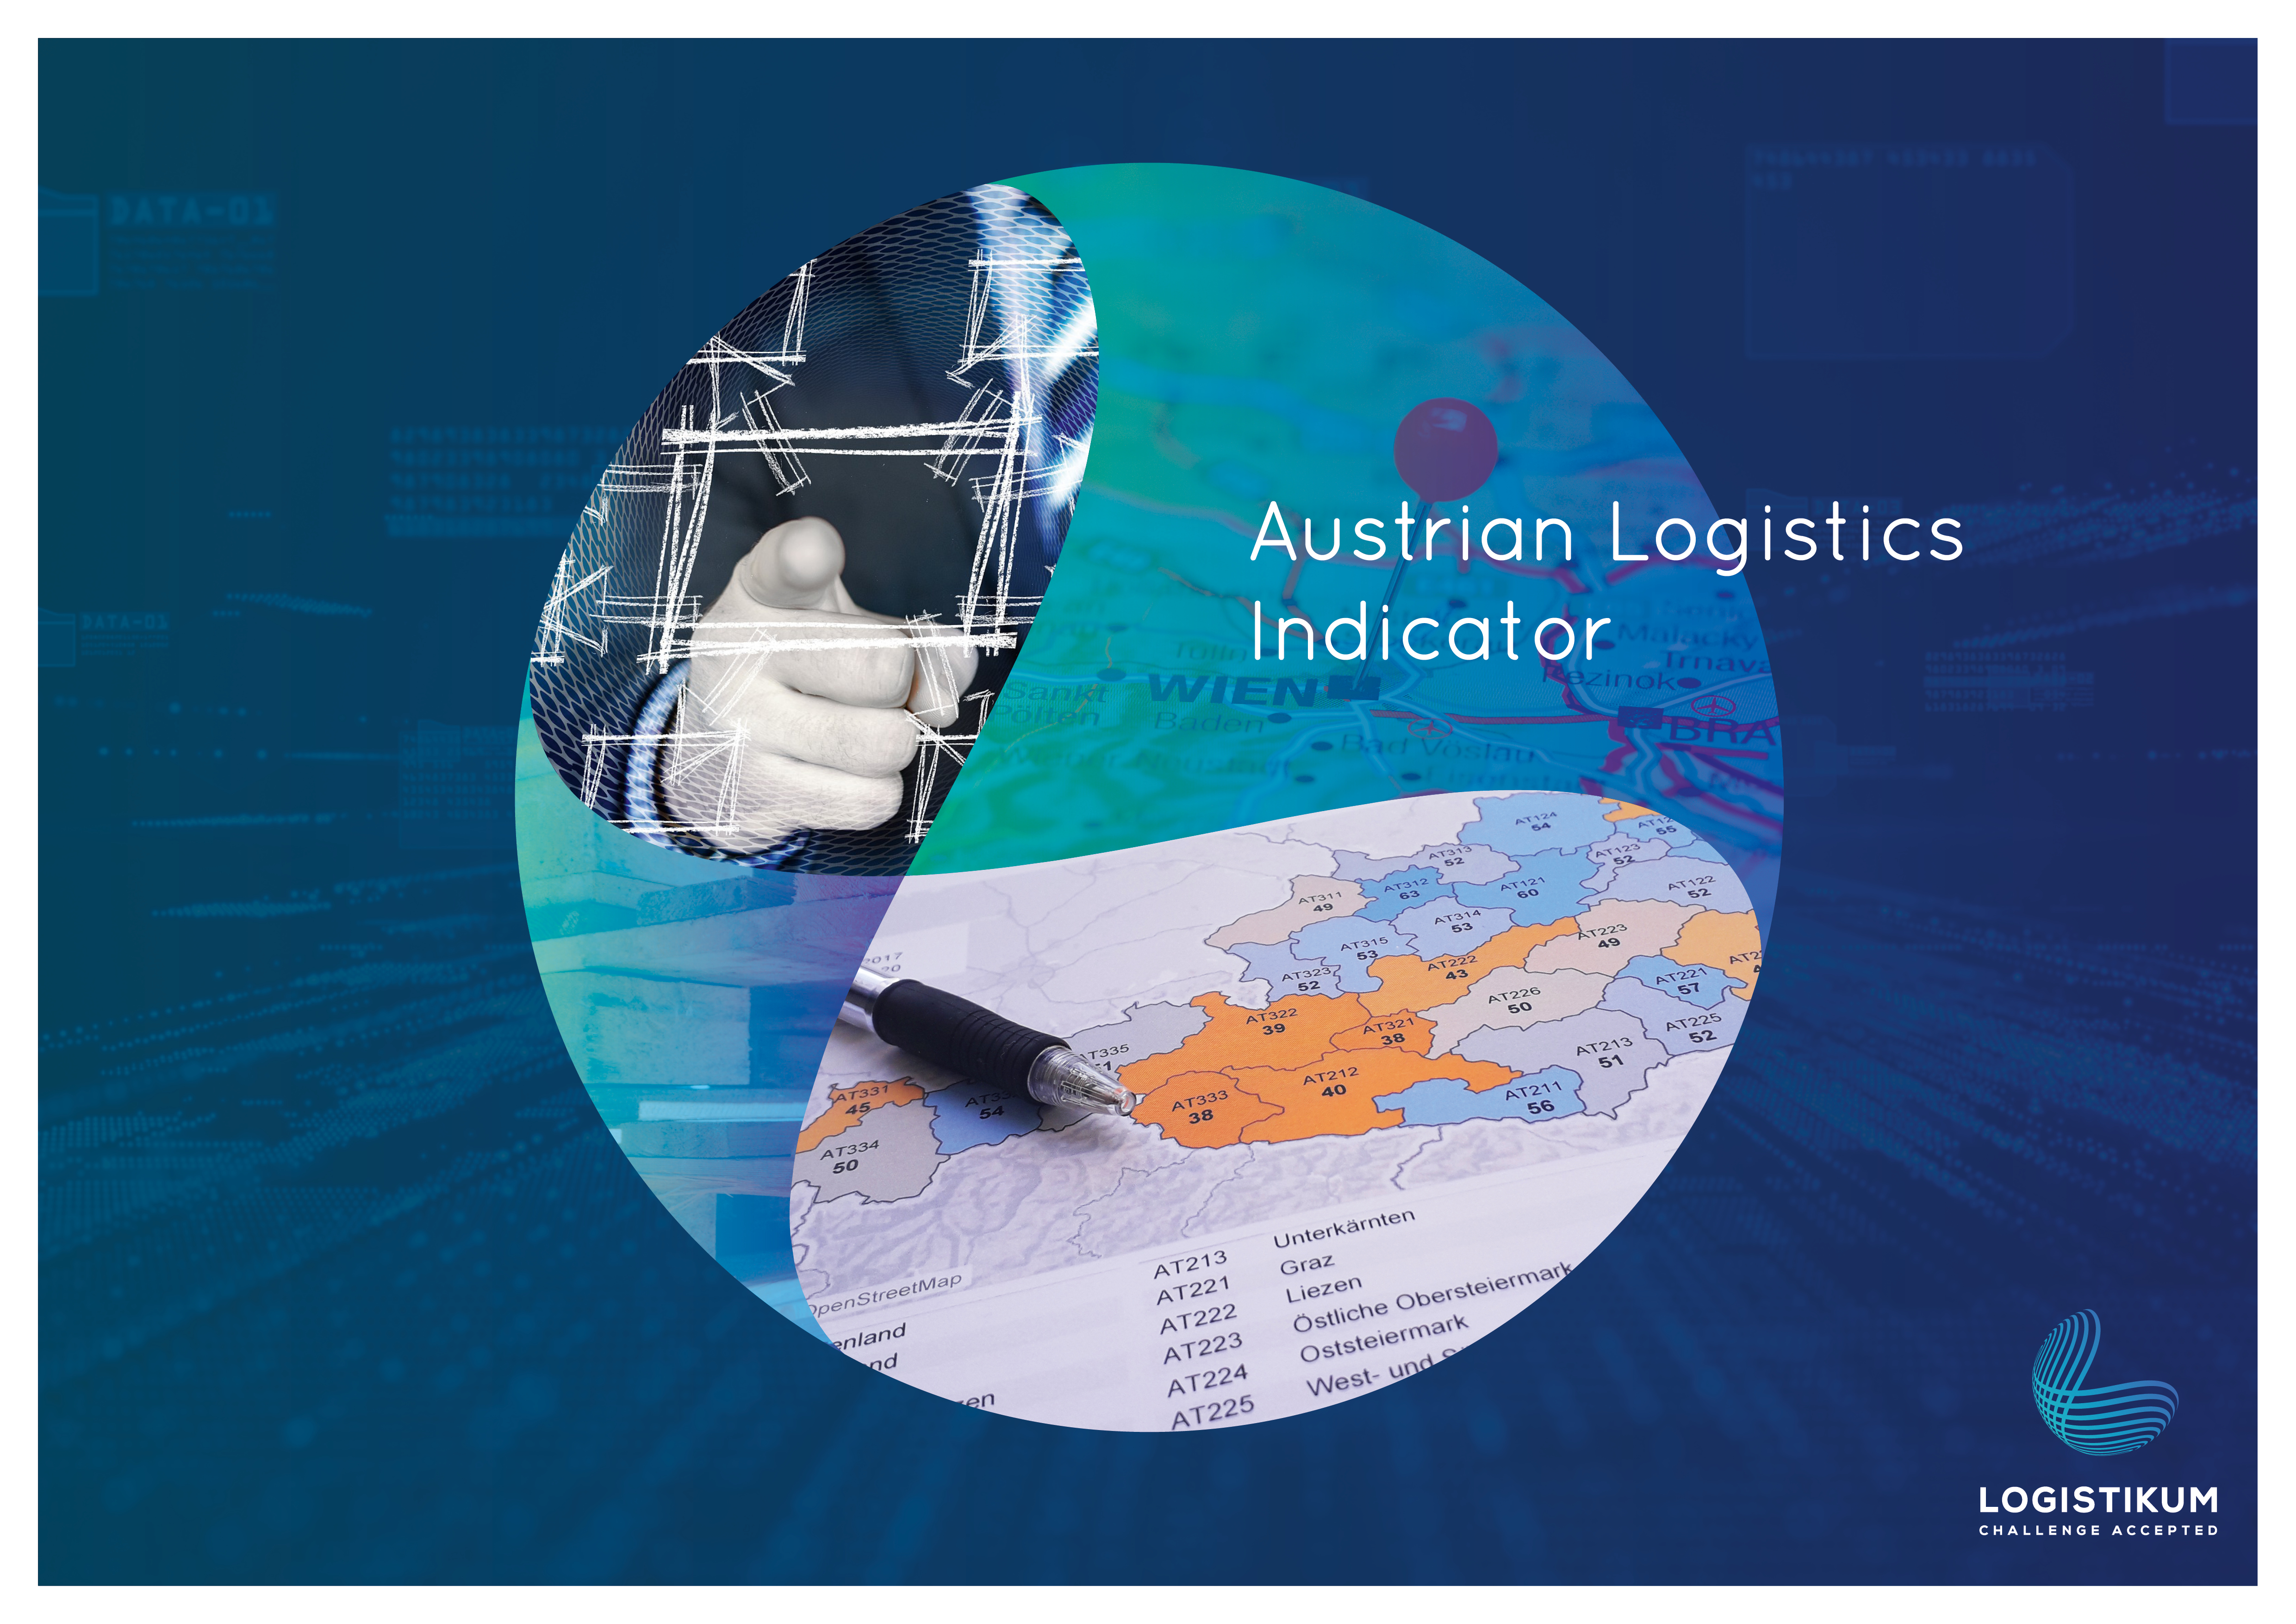
ALI - Austrian Logistics Indicator
Area of expertise: Supply Chain Management
MAKING LOGISTICAL PERFORMANCE MEASURABLE
What are the strengths of Austria’s regions in the field of logistics? This question was answered for the first time in 2017 in cooperation with the Federal Ministry for Climate Protection, Environment, Energy, Mobility, Innovation and Technology (BMK former BMVIT). In 2020, the logistics performance of 35 Austrian regions was surveyed by the ALI for the second time. For each region an individual report is available in German language. On the page research projects you find the project reports for the ALI surveys of 2017 and 2020 (only available in German language).
Here awaits you the platform of the ALI.online – the interactive data cockpit with all results of ALI.2017 and ALI.2020. This platform consists of 3 parts: ALI.overview, ALI.categories, ALI.customized. Please scroll down!
ALI.ONLINE
ALI uses distinct indicators to describe the logistical performance of Austria's regions at NUTS-3 level. Based on the results, we developed a user-friendly, interactive data cockpit that makes the results of the ALI publicly available to everyone free of charge, and individually analyzable.

ALI.overview
The overall result of the ALI surveys is presented here. The aim is to give you an overview of the regions' performance for each survey year as well as their development. You will also get a first insight into which main categories as well as subcategories make up the ALI. Scroll to the section of ALI.overview to try it!
ALI.categories
In this part of the ALI.online, you will learn all about the composition of the ALI. Moreover, you can investigate on how well regions perform in each major category, subcategory, and the separate metrics included in them. Metrics can be distinguished as to whether they use statistical data or data from the online-survey. To find out more, scroll down!
ALI.customized
In ALI.overview and ALI.categories you were presented with the big picture as well as the individual parts of the Logistics Indicator. Now in ALI.customized, you get the tools to reweight the composition of the ALI for your purposes or exclude individual categories. How does the result change for your region? Which key figures are specifically interesting for your industry?
User manual and further information
We have prepared aids to help you find your way around the ALI.online here:
Project Partners ALI.2020

